
App startup represents your app's first impression on users. And users don't like to wait, so you need to make sure that your app starts fast. To show you how a real-life app development team found and diagnosed issues with their app startup, here's what the Gmail Wear OS team did.
The Gmail Wear OS team undertook an optimization effort, with particular focus on app startup and runtime rendering performance, to meet their team's app performance criteria. However, even if you don't have specific thresholds to target, there's almost always room to improve app startup if you take some time to investigate it.
Capture a trace and look at app startup
To start analyzing, capture a trace that includes app startup for closer inspection in Perfetto or Android Studio. This case study uses Perfetto because it shows you what's happening across the device system, beyond your app. When you upload the trace in Perfetto, it looks like this:
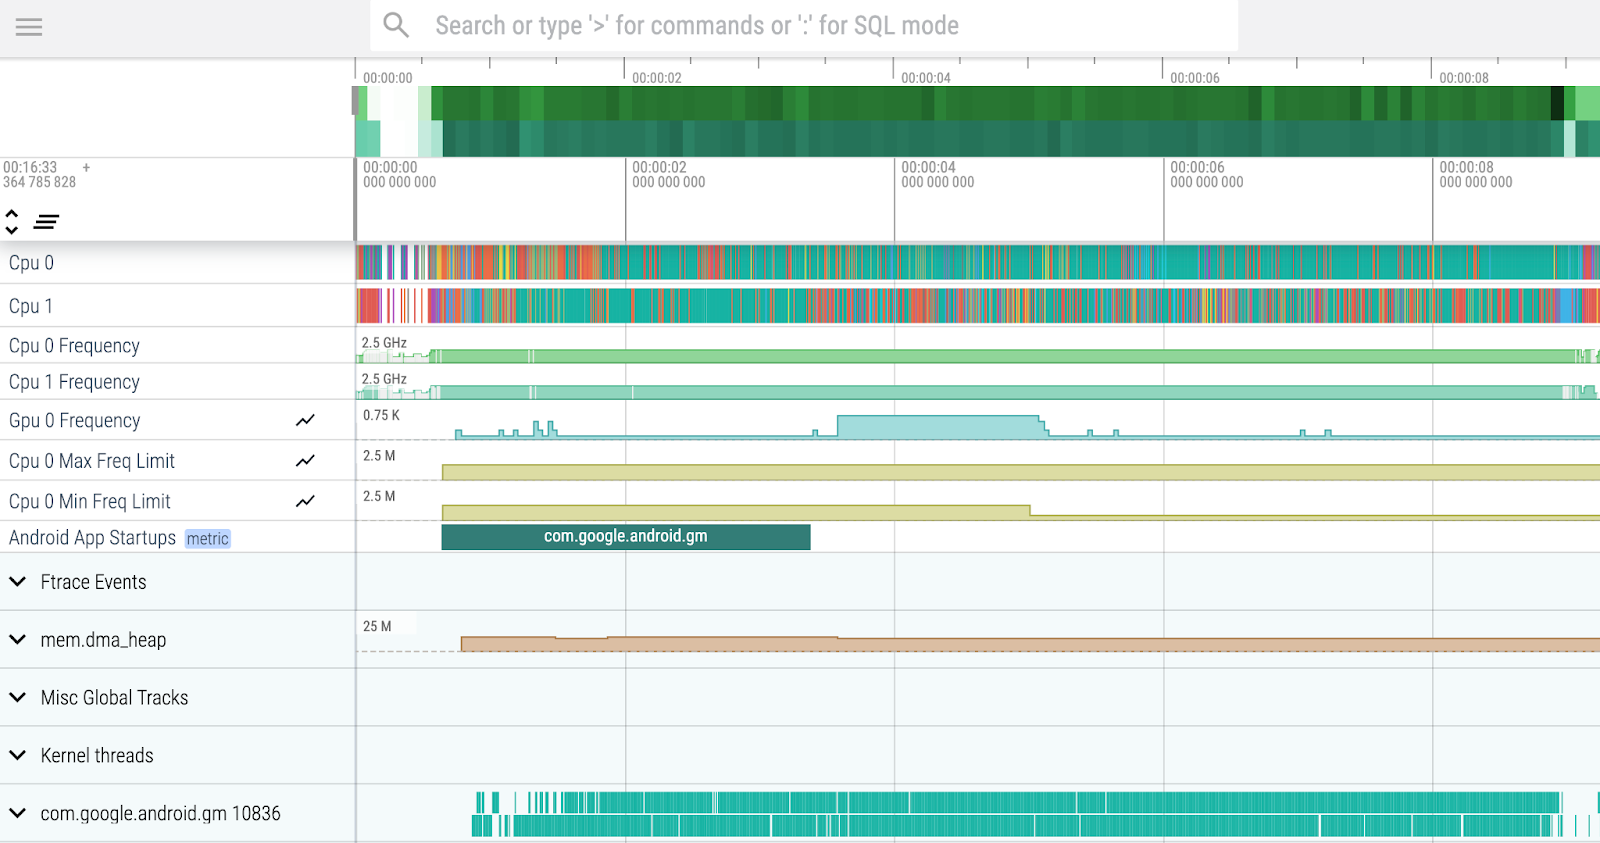
Since the focus is improving app startup, locate the row with the Android App
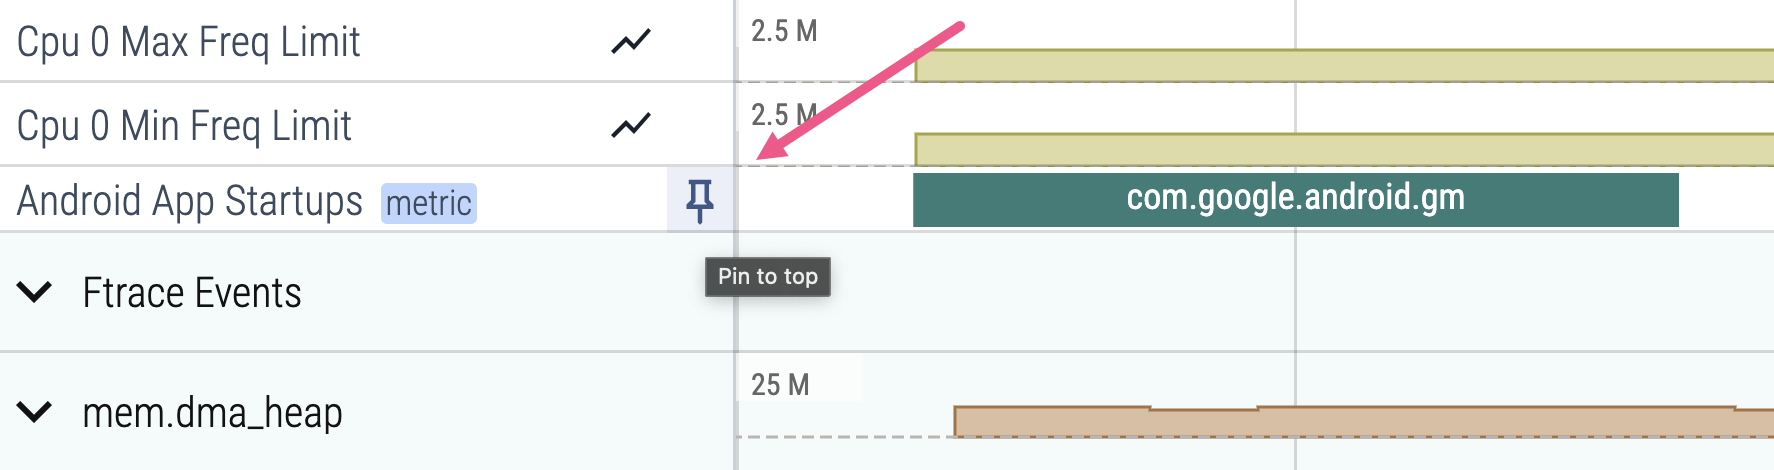
Startups custom metric; it's helpful to pin it to the top of your view by
clicking the pin icon
 that appears when you hover over the row. The bar, or slice, that you see on
the Android App Startups row indicates the range of time that app startup
covers, until the first app frame is drawn to the screen, so you should look for
issues or bottlenecks there.
that appears when you hover over the row. The bar, or slice, that you see on
the Android App Startups row indicates the range of time that app startup
covers, until the first app frame is drawn to the screen, so you should look for
issues or bottlenecks there.
Note that the Android App Startups metric represents the
time to initial display,
even if you're using reportFullyDrawn(). To identify the
time to full display, search
for reportFullyDrawn() in the Perfetto search box.
Check the main thread
First, examine see what's happening on the main thread. The main thread is very important because it's usually where all the UI rendering happens; when it's blocked, no drawing can happen and your app appears to be frozen. So you want to make sure that no long running operations are happening on the main thread.
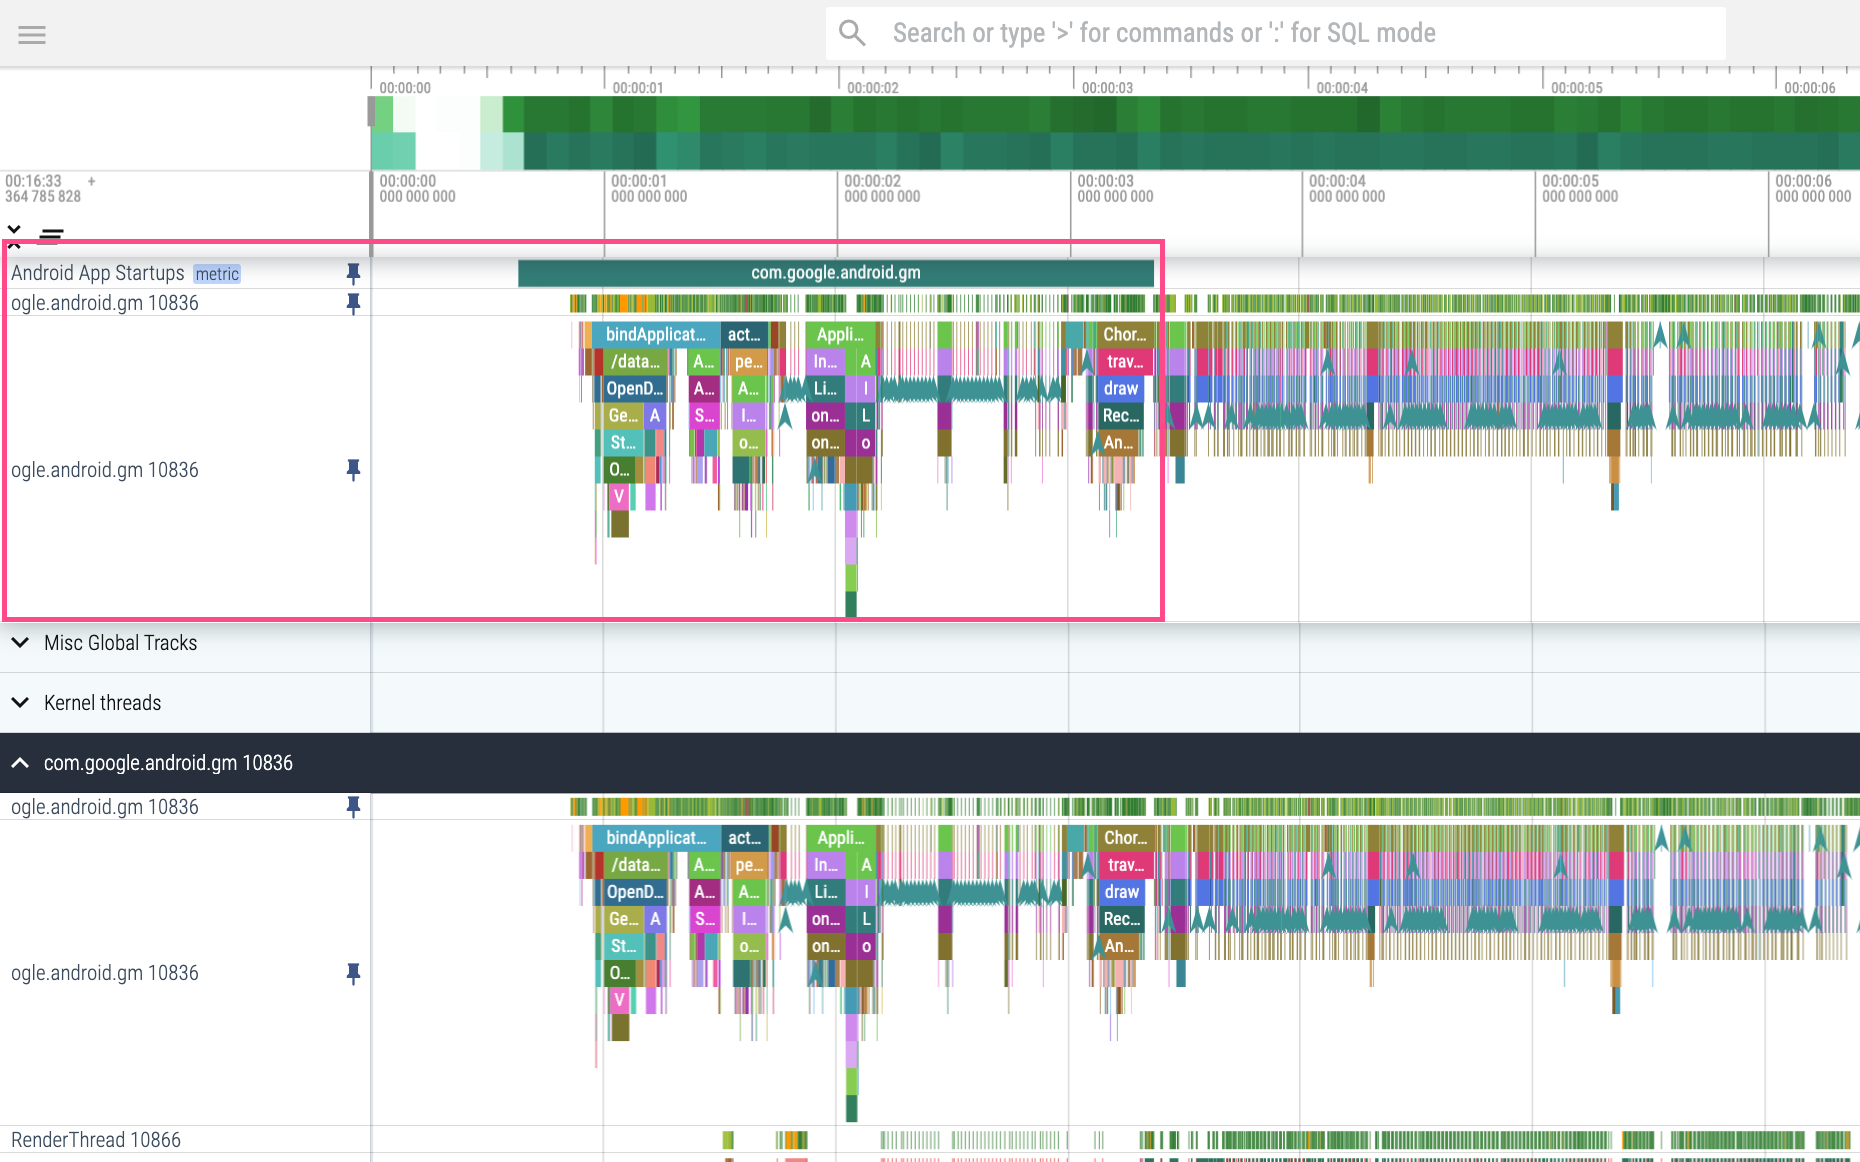
To find the main thread, find the row with your app's package name and expand it. The two rows with the same name as the package (usually the first two rows in the section) represent the main thread. Of the two main thread rows, the first represents CPU state and the second row represents tracepoints. Pin the two main thread rows below the Android App Startups metric.
Time spent in runnable state and CPU contention
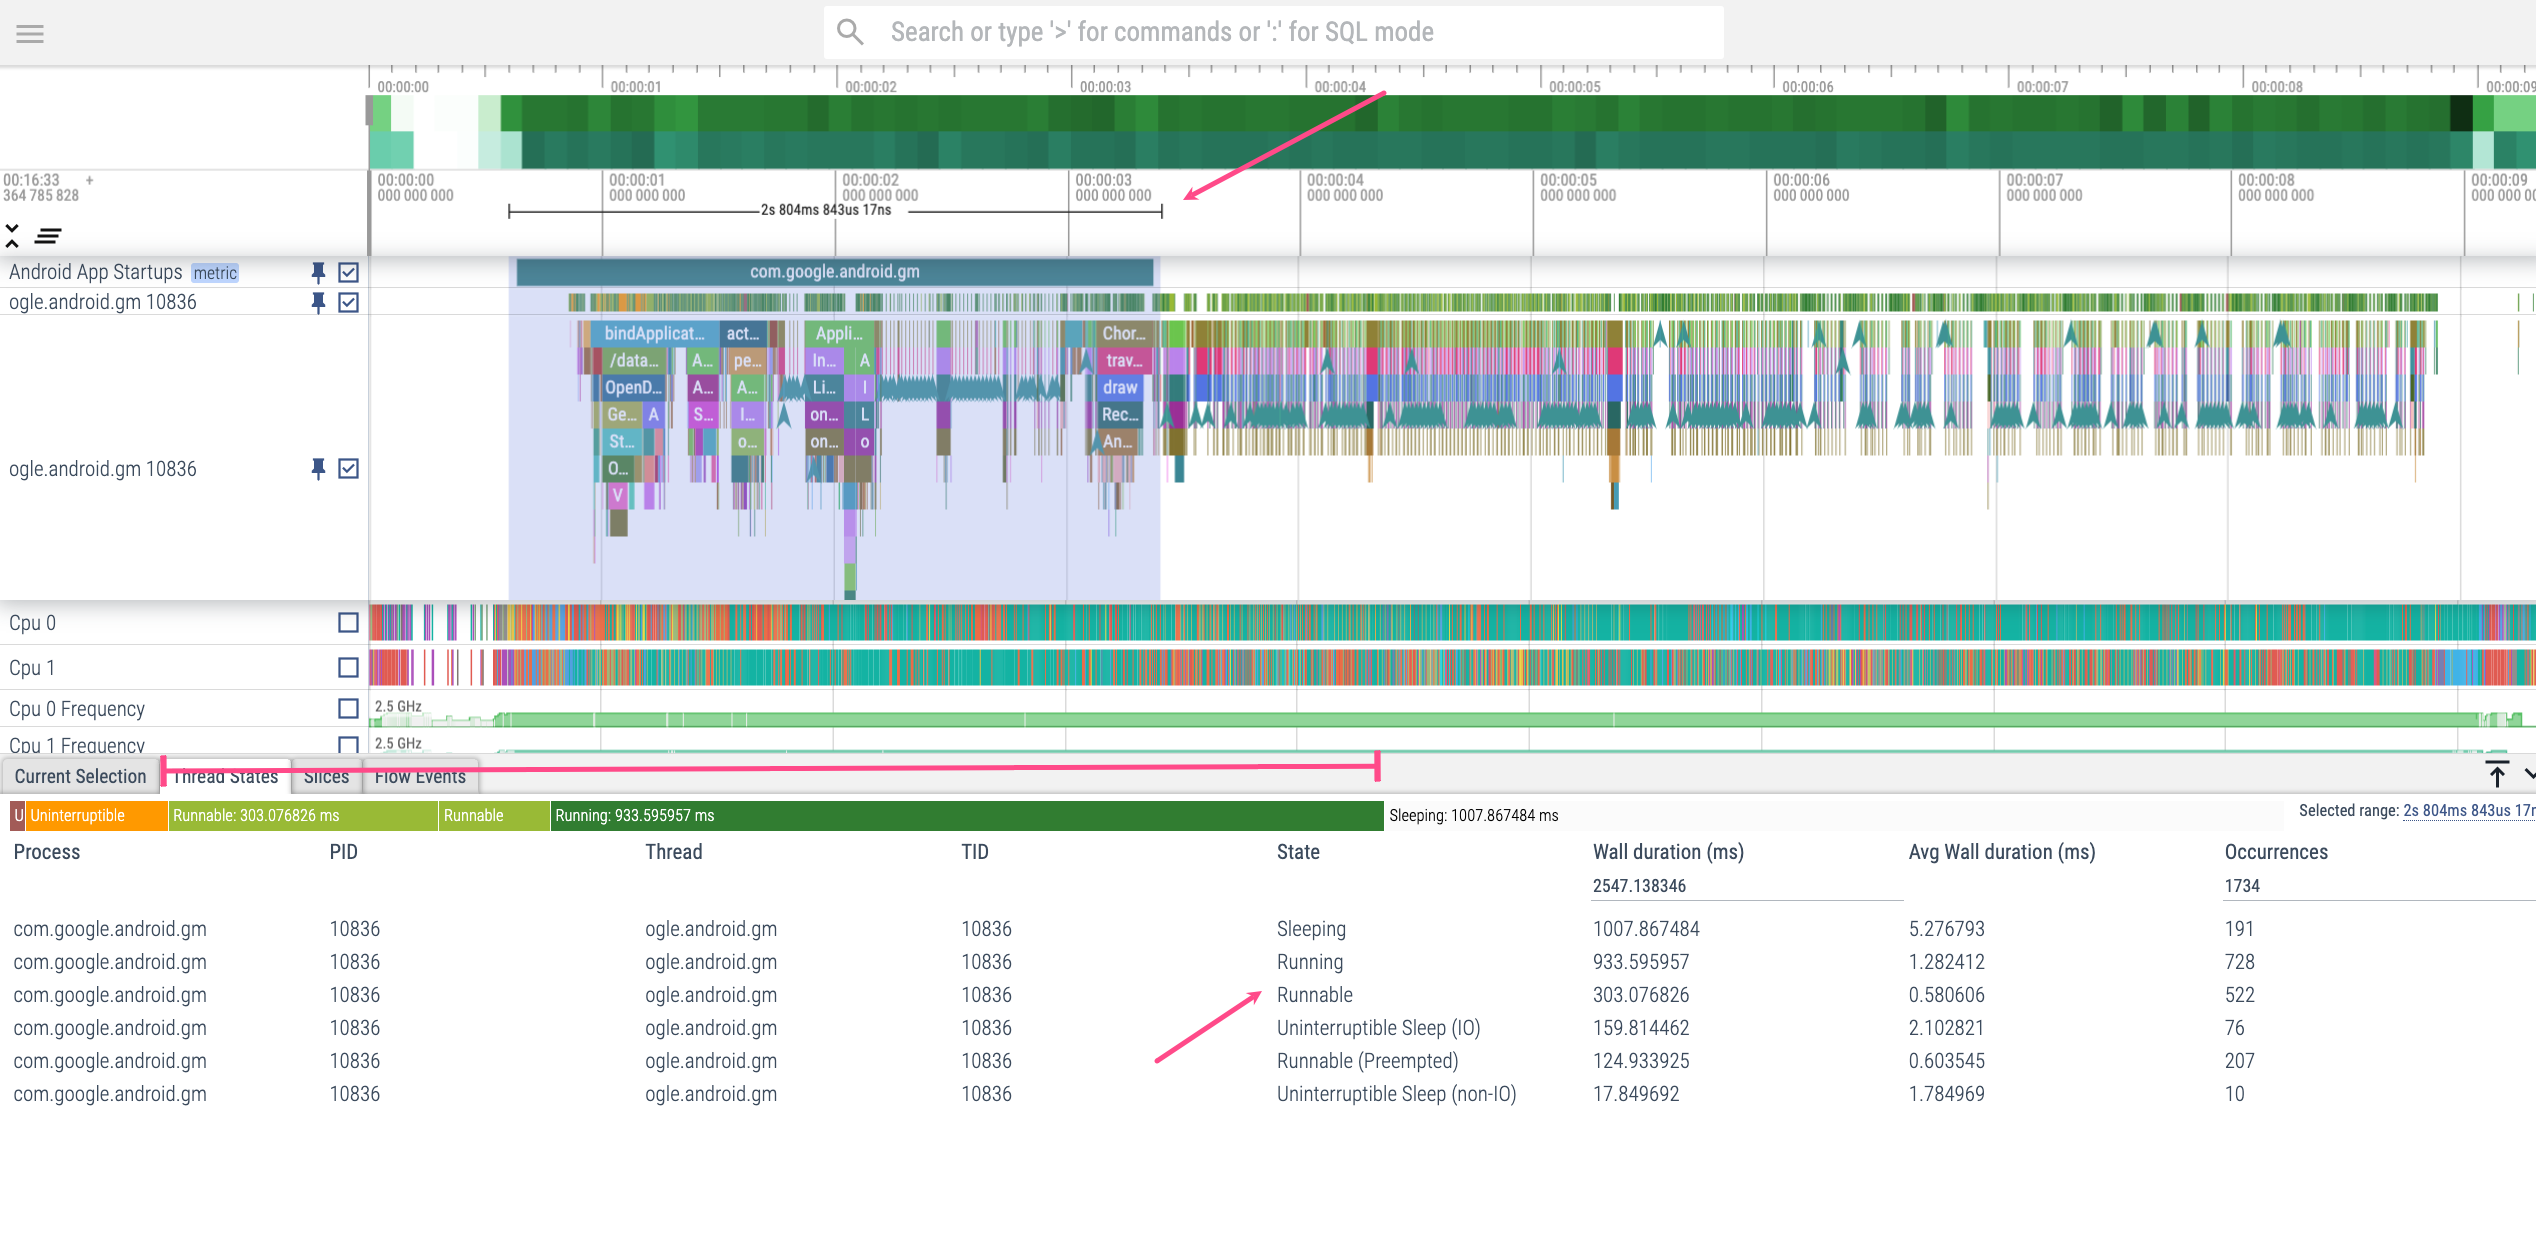
To get an aggregate view of the CPU activity during app startup, drag your cursor over the main thread to capture the app startup time range. The Thread States panel that appears shows you the total amount of time spent in each CPU state within your selected time range.
Look at time spent in the Runnable state. When a thread is in the Runnable
state, the thread is available to do work but no work is scheduled. That could
indicate that the device is under heavy load and unable to schedule high
priority tasks. The top, user-visible app has the highest priority in
scheduling, so an idle main thread often indicates that intensive processes
within your app, such as animation rendering, are competing with the main thread
for CPU time.
Runnable
to Running states to get an initial sense of how much CPU
contention there is.The higher the ratio of time in Runnable state to time in Running state, the
more likely there is CPU contention happening. When inspecting performance
problems in this way, focus on the longest running frame first and work towards
smaller ones.
When analyzing time spent in the Runnable state, consider the device hardware.
Because the app depicted is running on a wearable device with two CPUs, the
expectation is for more time spent in the Runnable state and more CPU
contention with other processes than if we were looking at a device with more
CPUs. Even though more time is spent in the Runnable state than expected for a
typical phone app, it might be understandable in the context of wearables.
Time spent in OpenDexFilesFromOat*
Now check the time spent in OpenDexFilesFromOat*; in the trace, it happens at
the same time as the bindApplication slice. This slice represents the time
taken to read the DEX files of the application.
Blocked binder transactions
Next check the binder transactions. Binder transactions represent calls between
the client and server: in this case, the app (client) calls the Android system
(server) with a binder transaction, and the server responds with a binder
reply. Make sure that the app doesn't make unnecessary binder transactions
during startup, since they increase the risk of CPU contention. If you can,
defer work that involves binder calls to after the app startup period. If you
have to make binder transactions, make sure they don't take longer than your
device's Vsync refresh rate.
The first binder transaction, usually occurring at the same time as the
ActivityThreadMain slice, seems to be quite long in this case. To find out
more about what might be happening, follow these steps:
- To see the associated binder reply and find out more about how the binder transaction is being prioritized, click the binder transaction slice of interest.
To see the binder reply, go to the Current Selection panel and click binder reply under the Following threads section. The Thread field also tells you the thread that the binder reply occurs on if you want to navigate there manually; it'll be in a different process. A line appears that connects the binder transaction and reply.
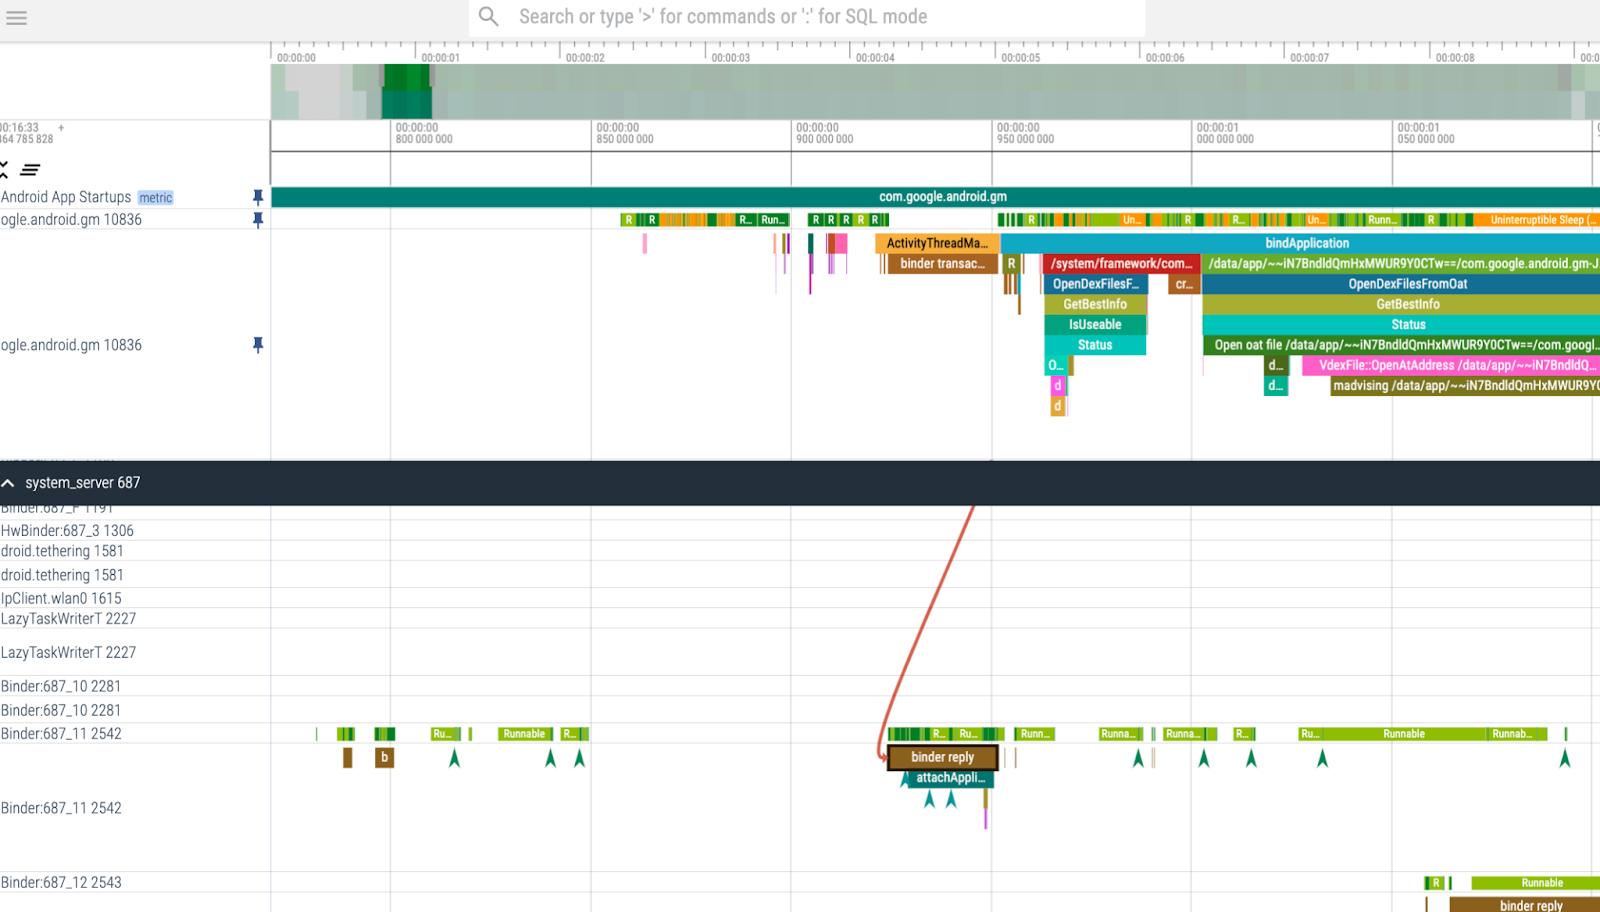
Figure 5. Identify the binder transactions happening during app startup and assess whether you can defer them. To see how the system server is handling this binder transaction, pin the Cpu 0 and Cpu 1 threads to the top of your screen.
Find the system processes that handle the binder reply by finding the slices that include the binder reply thread name, in this case "Binder:687_11 [2542]". Click the relevant system processes to get more information about the binder transaction.
Take a look at this system process associated with the binder transaction of interest that occurs on CPU 0:
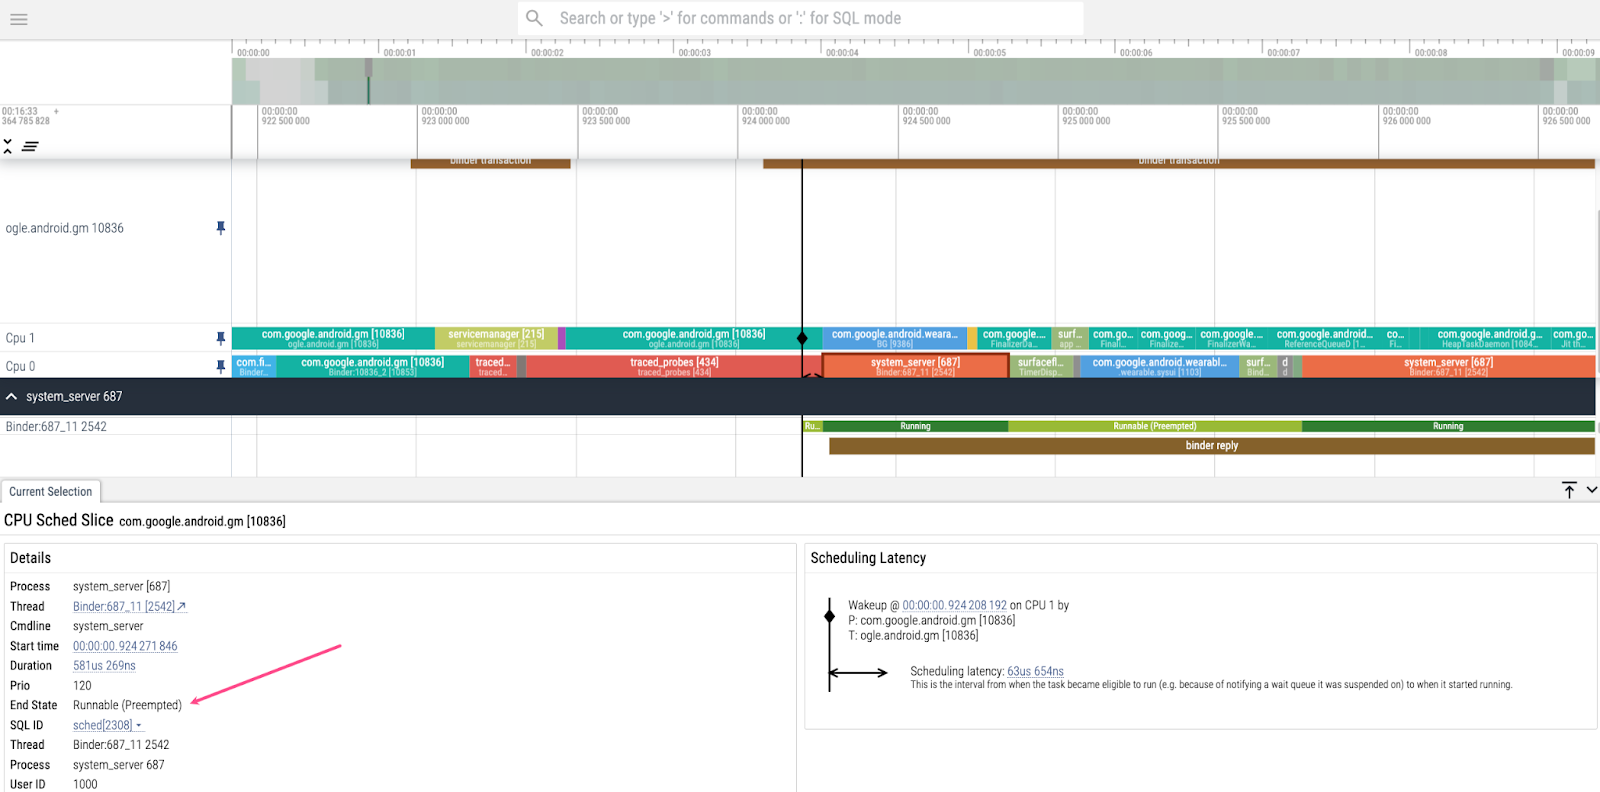
Runnable (Preempted) state, which indicates that it's getting
delayed.The End State says Runnable (Preempted), which means that the process is
getting delayed because the CPU is doing something else. To find out what it's
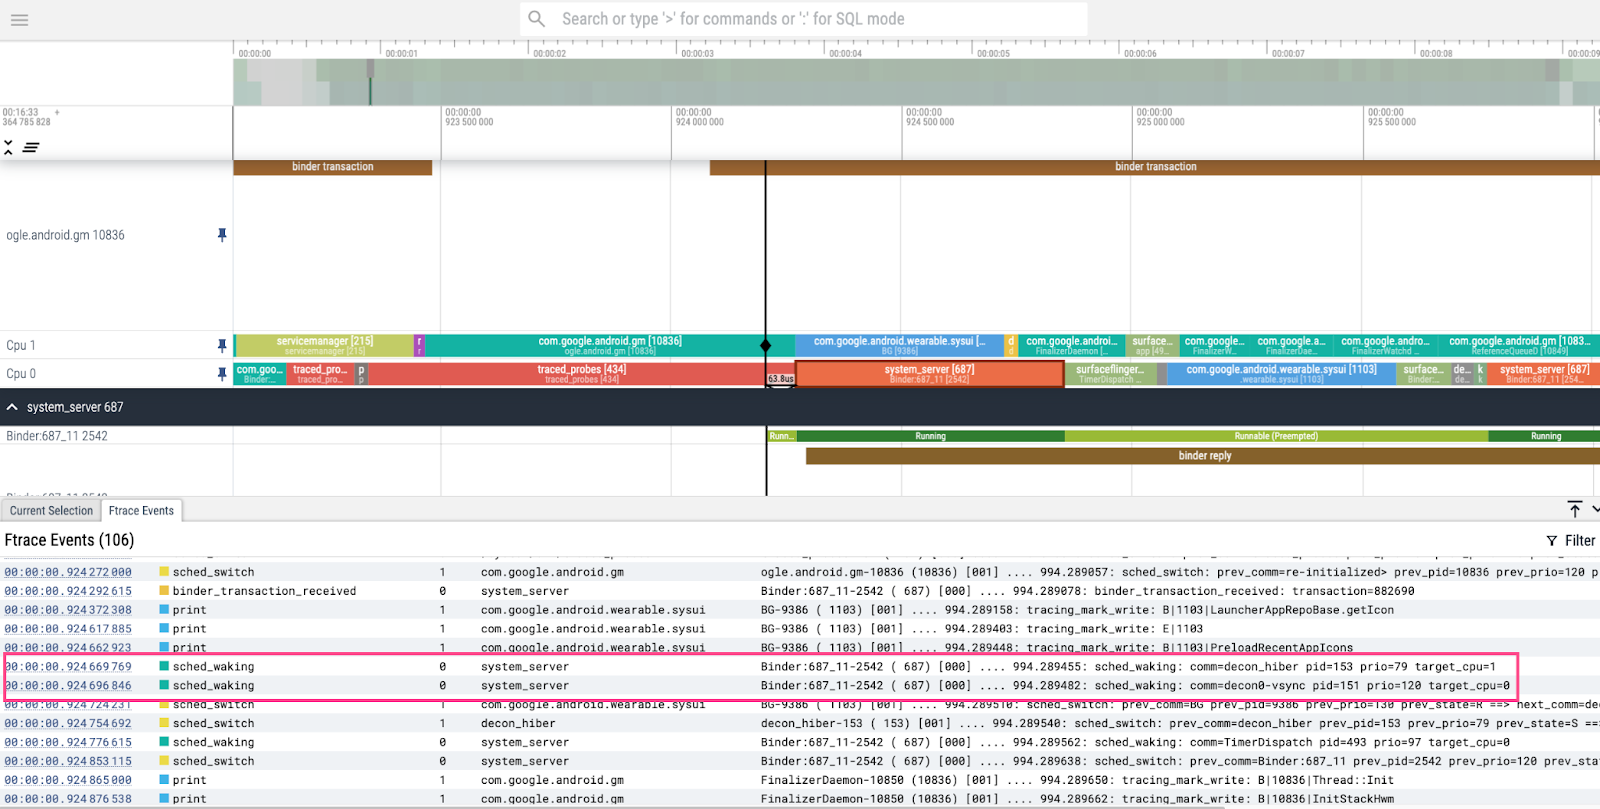
getting preempted by, expand the Ftrace Events rows. In the Ftrace
Events tab that becomes available, scroll through and look for events related
to the binder thread of interest "Binder:687_11 [2542]". Around the time at
which the system process gets preempted, two system server events that include
the argument "decon" occurred, which means that they're related to the
display controller. This sounds reasonable because the display controller puts
the frames on the screen—an important task! Leave the events as is, then.
JIT activity
To investigate just-in-time compilation
(JIT) activity,
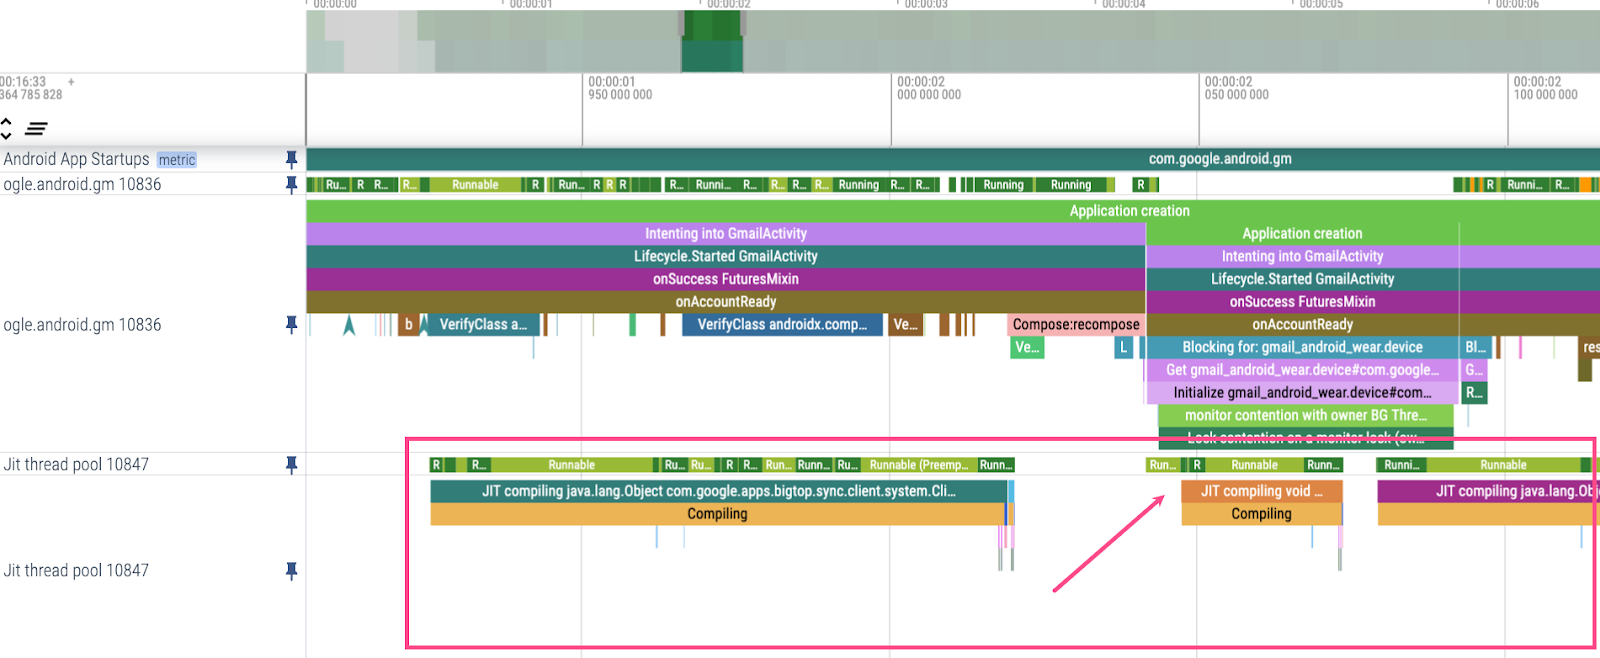
expand the processes belonging to your app, find the two "Jit thread pool" rows,
and pin them to the top of your view. Because this app benefits from Baseline
Profiles during app startup,
very little JIT activity occurs until the first frame is drawn, signified by the
end of the first Choreographer.doFrame call. However, notice the slow start
reason JIT compiling void, which suggests that the system activity happening
during the tracepoint labeled Application creation is causing a lot of
background JIT activity. To resolve this, add the events that happen shortly
after the first frame is drawn to the Baseline Profile by expanding the profile
collection to a point where the app is ready to be used. In many cases, you can
do this by adding a line to the end of your Baseline Profile collection
Macrobenchmark test that waits for a particular UI widget to appear on your
screen, indicating that the screen is fully populated.
Results
As a result of this analysis, the Gmail Wear OS team made the following improvements:
- Since they noticed contention during app startup when looking at the CPU activity, they replaced the spinner animation used to indicate that the app is loading with a single static image. They also prolonged the splash screen to defer shimmer state, the second screen state used to indicate that the app is loading, to free CPU resources. This improved app startup latency by 50%.
- From looking at time spent in
OpenDexFilesFromOat*and JIT activity, they enabled R8 rewriting of Baseline Profiles. This improved app startup latency by 20%.
Here are some tips from the team on how to analyze app performance efficiently:
- Set up an ongoing process that is able to automatically collect traces and results. Consider setting up automated tracing for your app using benchmarking.
- Use A/B testing for changes you think will improve things, and reject them if they don't. You can measure the performance under different scenarios using the Macrobenchmark library.
To learn more, see the following resources:
- Performance: Using sampling profiling with Systrace - MAD Skills
- Performance: Capturing Profiler traces - MAD Skills